

 14Hours ago
Paid Social traffic usually costs more per thousand impressions than Popunder. The question is whether that extra cost pays for itself once you look past registrations and down to actual deposits. One of our partners ran a clean 30-day A/B test on an iGaming offer to find out — and this was already their fourth time testing Paid Social Traffic against Popunder on this vertical.
About the Campaign Setup
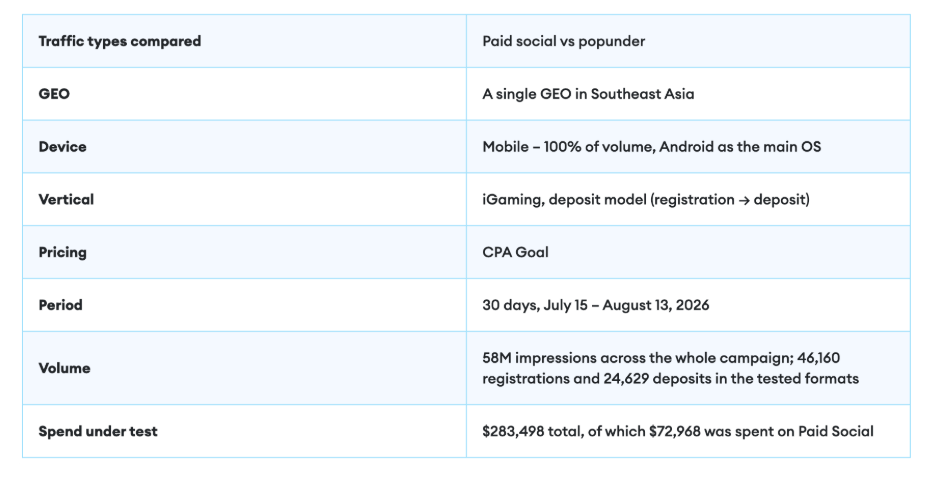
To keep the comparison honest, everything except traffic type stayed identical: same offer, same device and pricing settings, same testing window, same GEO. The only thing that changed between the two campaigns was the traffic source — Paid Social vs. Popunder — so any gap in results could be traced back to that one variable.
The Campaign Flow
At the registration stage, the results showed no significant difference between the two formats.
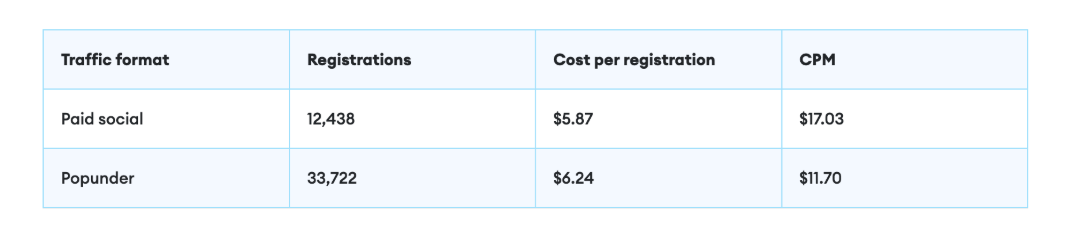
At the registration stage, there was barely any difference between the two formats. Paid Social cost 1.5× more per impression but brought in registrations at almost the same price. If the test had stopped there, paying extra for Paid Social wouldn't have made much sense.
The gap opened up at the deposit stage. Among registered users, 59.3% went on to deposit through Paid Social, against 51.2% for Popunder. Paid Social traffic turned out to be made up of users who were simply more ready to act on what they saw.
Over the full test:
·
Paid Social: 7,375 deposits at $9.89 each·
Popunder: 17,254 deposits at $12.20 each
·
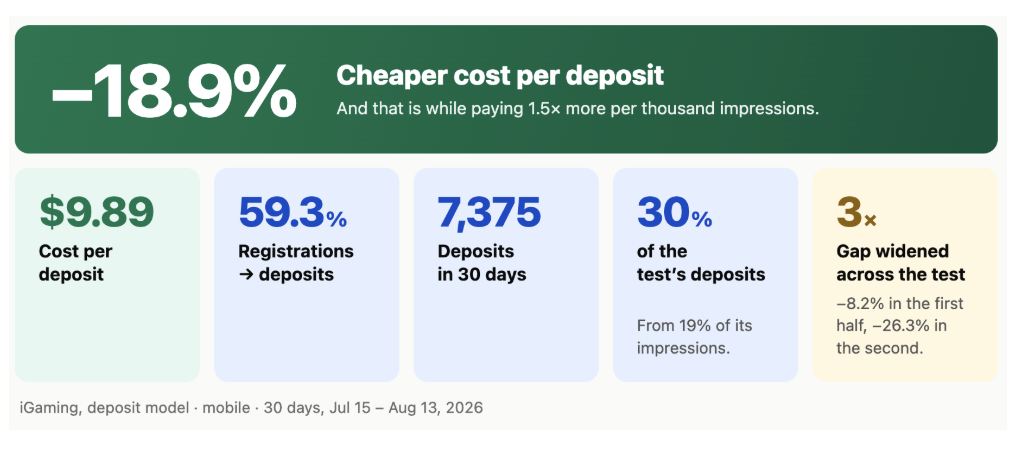
That's an 18.9% lower cost per deposit on Paid Social — despite the higher CPM.
A simpler way to see it: take 100 registrations from each source. Paid Social cost $587 and turned into 59 deposits. Popunder cost $624 and turned into 51 deposits. Similar spend, but Paid Social converted more of it into paying users.
Results and the Full Comparison
Popunder still produced more total deposits — but it also ran on 4× the volume. Match the volumes up, and Paid Social Traffic generated nearly twice as many deposits per impression. Across the whole test, Paid Social accounted for 30% of all deposits from just 19% of total impressions.
The gap also widened over time. In the first half of the test, Paid Social's cost per deposit was 8.2% lower than Popunder's. By the second half, that gap grew to 26.3%. The reason: the share of Paid Social registrations converting into deposits climbed from 51.7% to 66.1%, while Popunder barely moved, from 51.0% to 51.3%.
The Takeaway
Paid Social Traffic cost more upfront, but it delivered 1.8× as many deposits per thousand impressions, and an 18.9% lower cost per deposit overall. That doesn't make it the "better" source across the board — Popunder still pulled in more raw volume. What it does show is that judging traffic by CPM or registrations alone can hide what actually happens at the conversion that pays the bills.